
Website: Analytics
Learn how to view, compare, and customize GA4 traffic and engagement metrics from the Website Analytics dashboard.
The Analytics page shows Google Analytics 4 data for the connected client website. It provides important traffic and engagement metrics in a single dashboard.
Access the Analytics Page
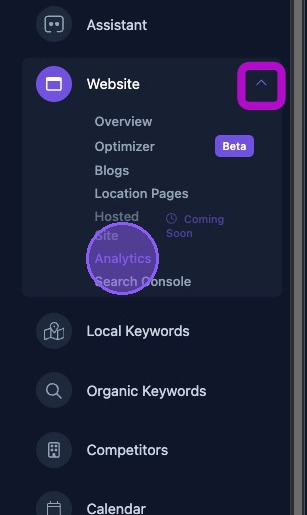
To access the Analytics page, click the dropdown arrow next to the Website section of the business dashboard. Then click Analytics.
Navigating the Analytics Page
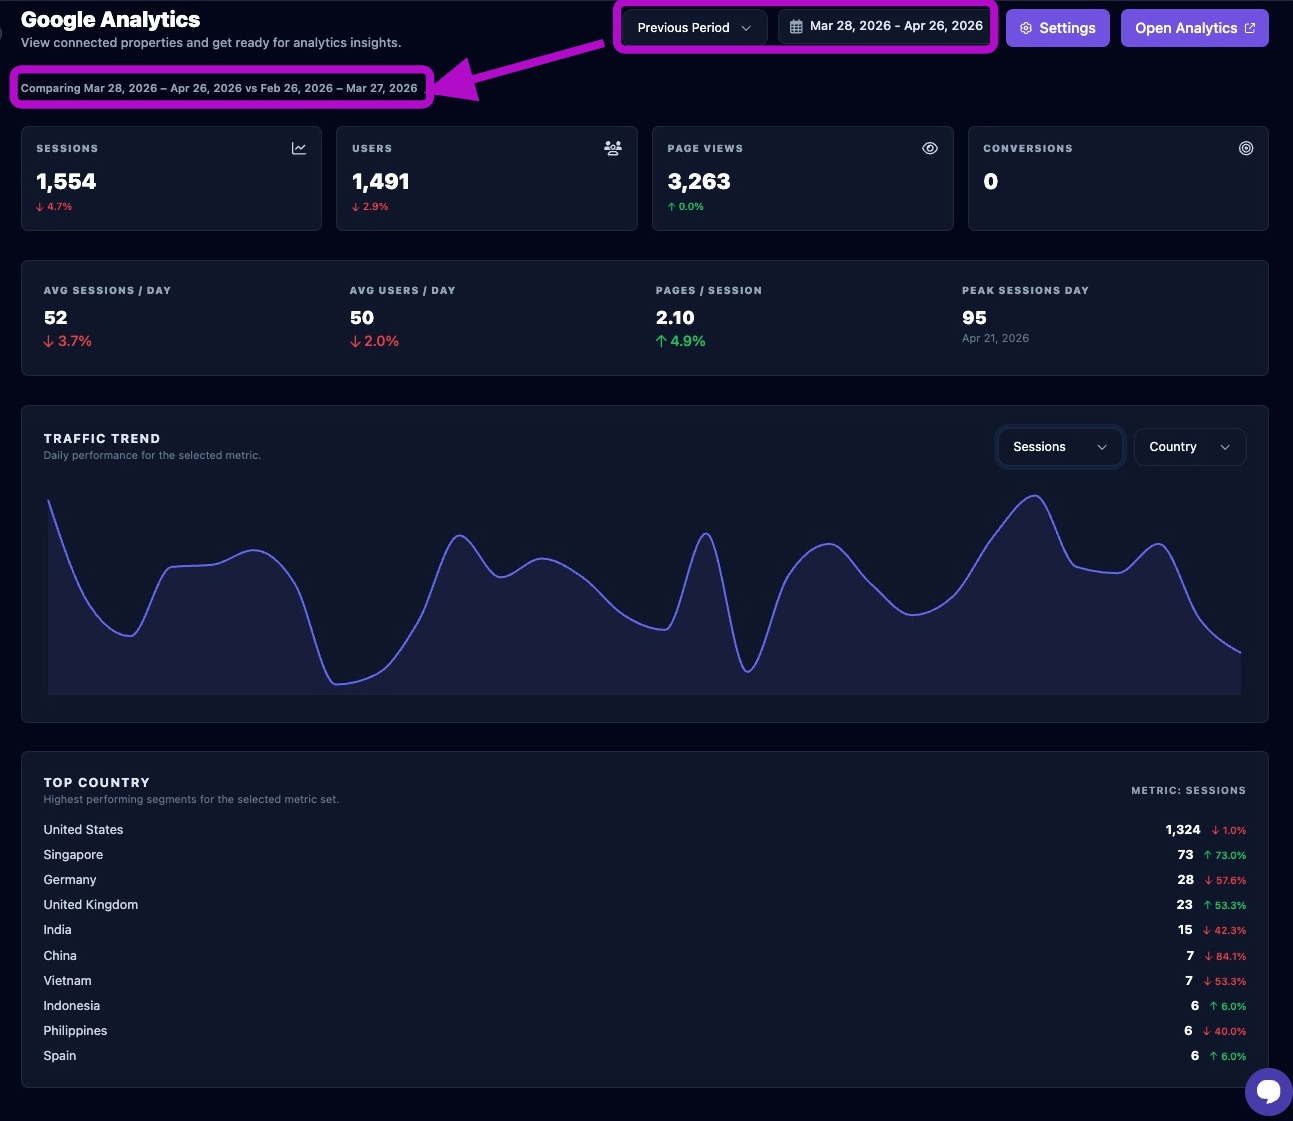
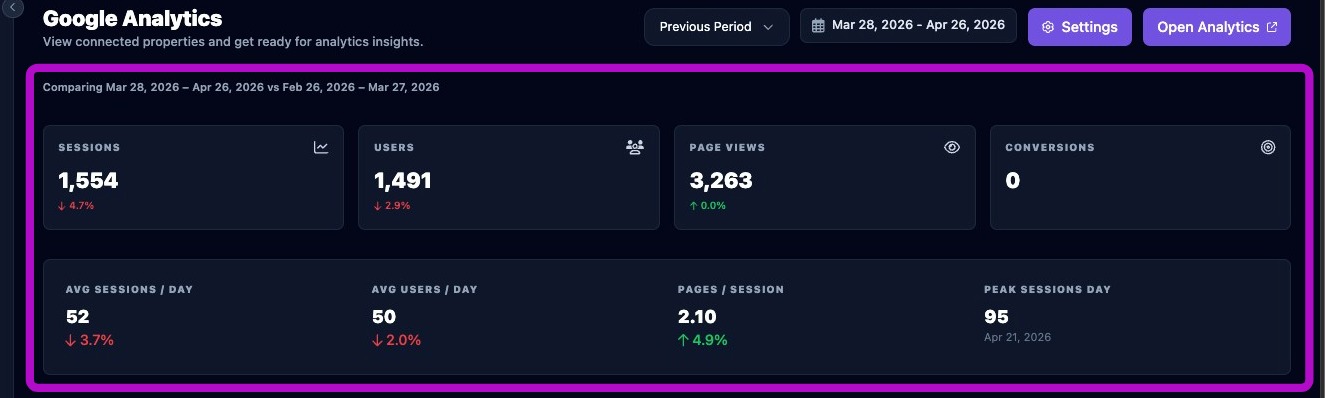
The Analytics page displays top Google Analytics 4 metrics in one easy-to-read dashboard.
At the top right of the page, you will find the current date range and the date comparison selection. These settings are reflected in the dashboard metrics, comparing the selected date range against the chosen previous range.
Change the Date Range
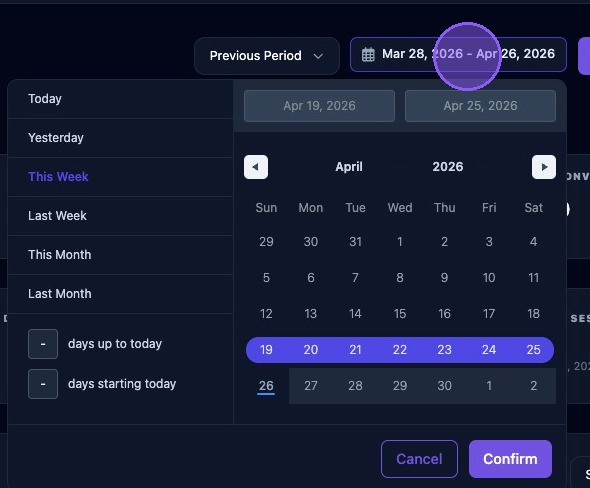
The date range selector filters which analytics data is displayed. By default, the system shows the last month. To choose a new date range, click the current date range to open the date selector.
Available preset range options include:
- Today.
- Yesterday.
- This Week, from Sunday through the current day of the week.
- This Month, from the first day of the month through today.
- Last Month, covering the full previous month.
To use a custom range, choose from these options:
- Enter a number of days prior to today to create a range ending today.
- Click a day in the calendar as a start or end date, then drag forward or backward to select a range.
- Hold the Shift key and click another date to select a range.
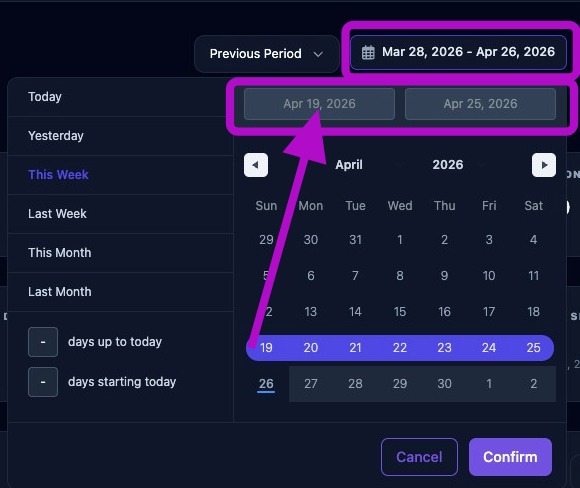
Check the newly selected date range just above the calendar, below the previous date range displayed above the selector window.
Click Confirm to update the analytics data for the new date range. Click Cancel to return without updating the date range.
Select the Previous dropdown menu to choose the comparison data option used to show trends.
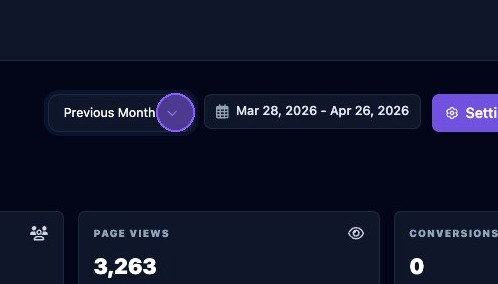
Comparison options include Previous Period, Previous Month, Previous Year, or None.

Linking a Property
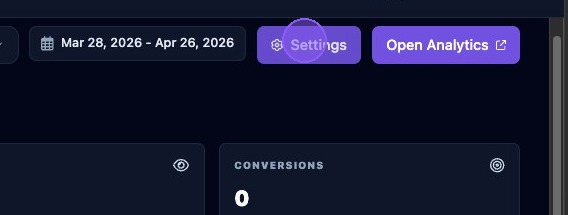
The Settings button is a quick link to the Business Settings page.
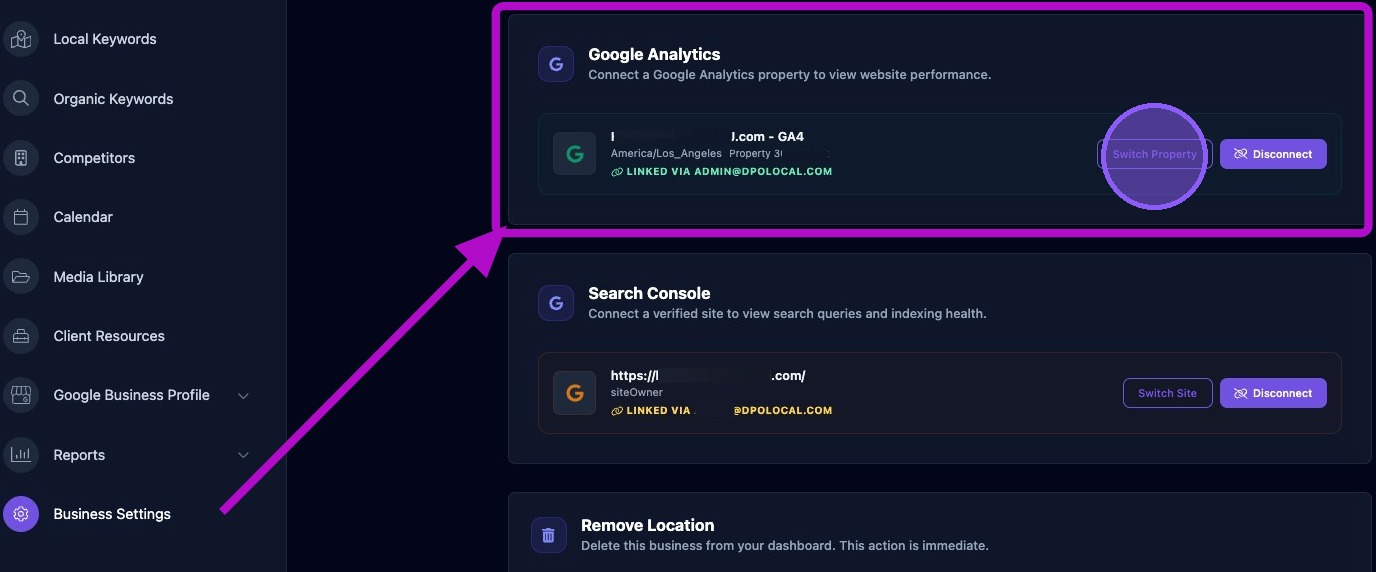
The Google Analytics section in Business Settings is where you link the Google Analytics property. Choose the client's GA4 property and click Connect.
Click Disconnect to disconnect a property.
Click Switch Property to switch to a different property.
Opening Google's Analytics Site
Click Open Analytics to open Google's Analytics website in a new browser window.
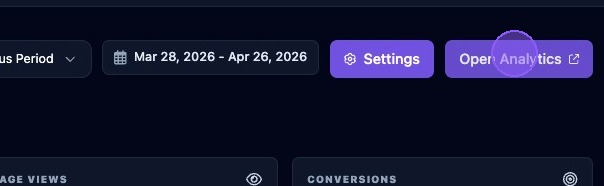
Log in using your Google account.
Metrics
Metrics are shown for the selected date range. Each metric includes a percentage trend up, shown in green, or down, shown in red, compared against the selected previous period. Metrics include:
- Sessions.
- Users.
- Page views.
- Conversions.
- Average sessions per day.
- Average users per day.
- Pages per session.
- Peak session day, including date and volume.
Changing Trend Metrics
The Traffic Trend section shows daily performance for the selected metrics. Hover over the graph to display the date and value for each day represented on the graph.
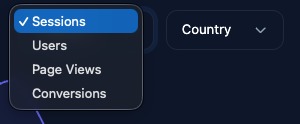
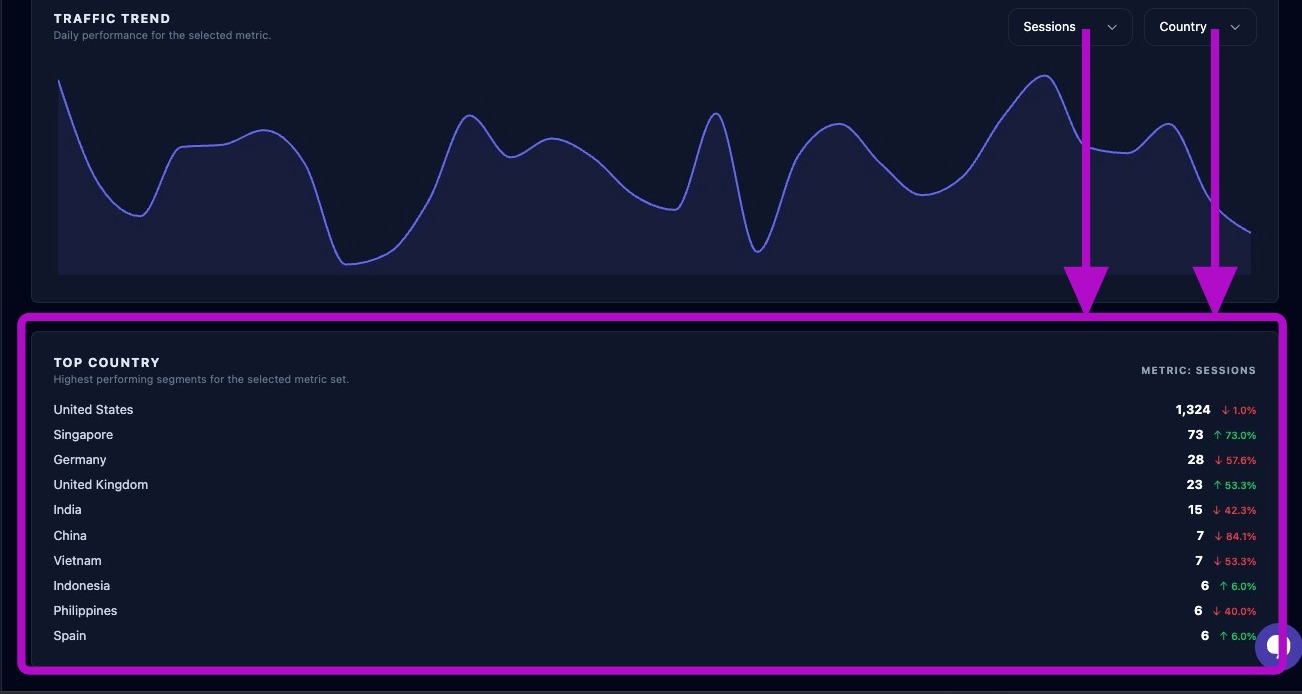
Click the two dropdown menus to change the metrics shown in the Traffic Trend graph.
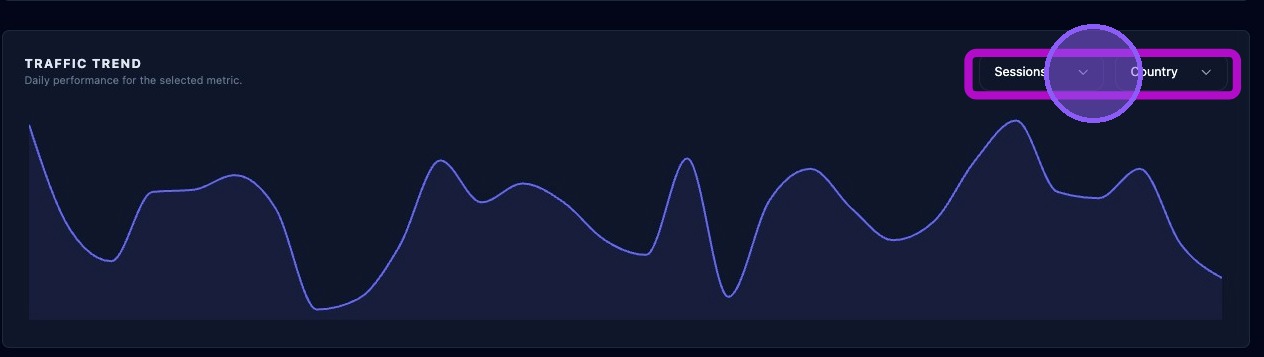
Select the desired metrics from the two dropdown menus:
- Sessions, users, page views, or conversions.
- Country, device, channel, or page path.

Highest Performing Segments Display
The last section displays the highest performing segments for the selected metric set, search type, and date range. Each displayed segment includes a value and a percentage trend up, shown in green, or down, shown in red, based on the selected comparison period.
Any changes to the Traffic Trend metric selections or date range are reflected here immediately.
Compare similar date ranges when evaluating trends, and confirm the correct GA4 property is connected before using the data for reporting or client analysis.