
Google Business Profile: Performance
Learn how to use the Google Business Profile Performance page to monitor views, actions, calls, direction requests, website clicks, search keywords, and performance trends.
The Performance page is a dashboard that shows actions, views, and engagement metrics pulled from Google Business Profile. This data helps power reporting and trend indicators.
If Google Business Profile data is available, metrics should usually show activity. If every metric shows zero, check that the profile is authenticated, confirm the selected date range, and retry after the data has had time to refresh.
Accessing the GBP Performance Page
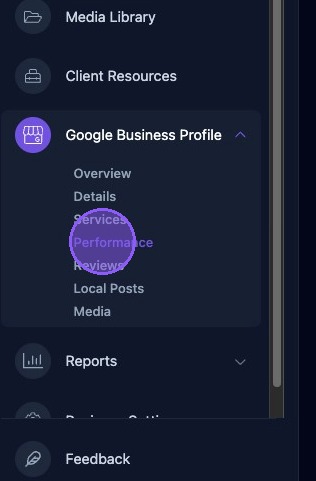
To access the page, click Performance under Google Business Profile in the dashboard.
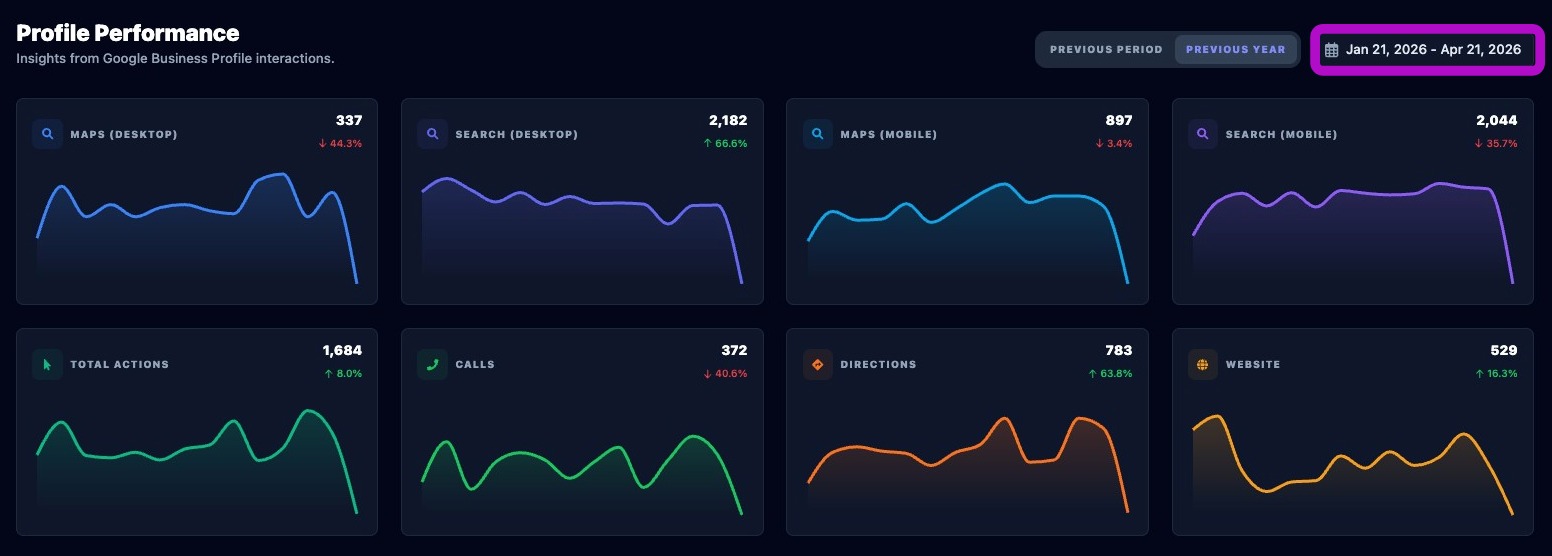
The top of the Performance page displays eight panels showing Google Business Profile metrics, including:
- Maps views on desktop and mobile.
- Search views on desktop and mobile.
- Total actions.
- Calls.
- Direction requests.
- Website clicks.
The data displayed in each panel is based on the date range shown in the upper-right corner.
Changing the Performance Date Range
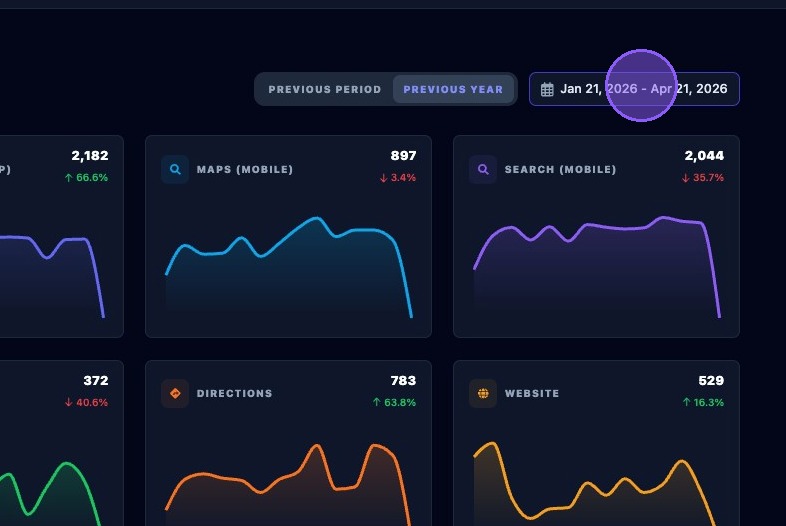
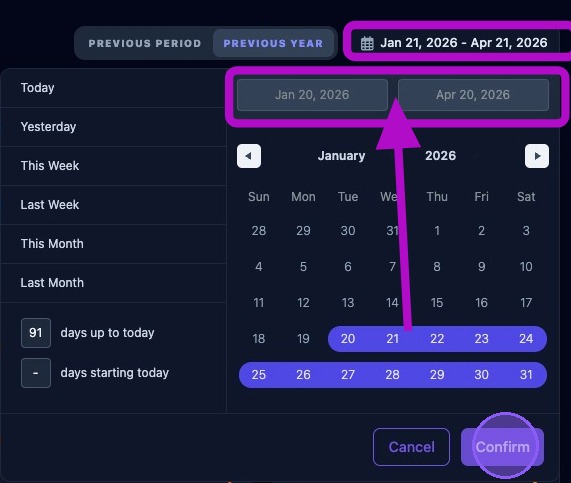
Click the date range in the upper-right corner to open the date range selector. In this example, click Jan 21, 2026 - Apr 21, 2026.
Choose a date range using the selector. You can choose either a preset range or a custom range.
Available preset range options include:
- Today.
- Yesterday.
- This Week, from Sunday through the current day of the week.
- This Month, from the first day of the month through today.
- Last Month, covering the full previous month.
To use a custom range, choose from the following options:
- Enter a number of days prior to today to create a range ending today.
- Click a day in the calendar as a start or end date, then drag forward or backward to select a range.
- Hold the Shift key and click another date to select a range.
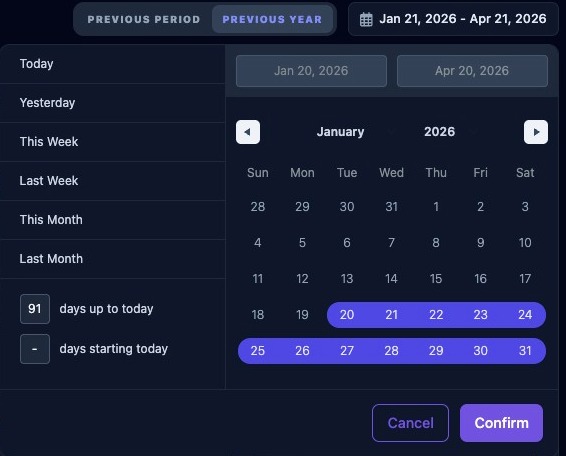
Check the newly selected date range just above the calendar and below the previous date range shown at the top of the selector window.
Click Confirm to update all performance data on the page for the new date range. Click Cancel to return without updating the date range.
The Comparison Toggle
You can compare the current trends against the previous period or the previous year by clicking either tab next to the date range.
The comparison is reflected in the percentage increase or decrease shown throughout the metrics on this page.
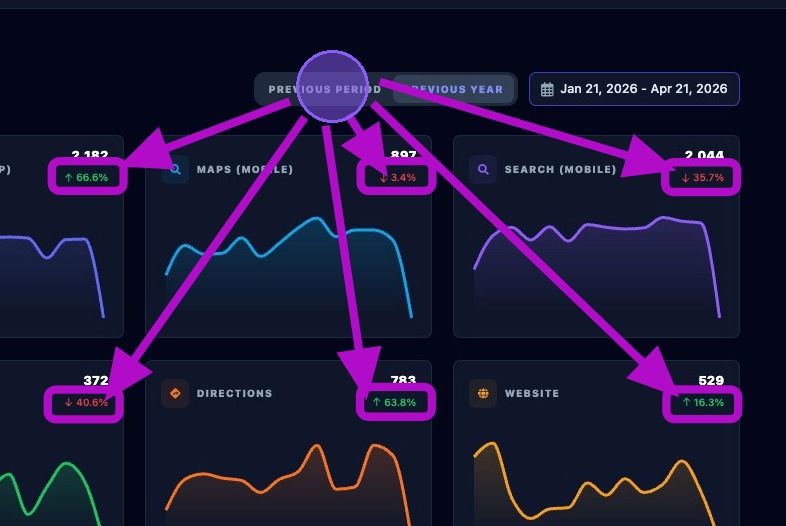
Navigating a Metric Panel
Each metric panel displays the following information:
- The total number of times that metric occurred during the selected period.
- The percentage increase, shown in green, or decrease, shown in red, based on the selected comparison toggle.
- A graph showing volume throughout the selected period.
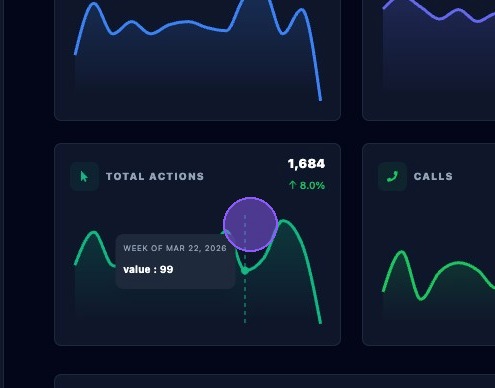
Click inside the graph area of a metric panel to display a cursor. Use it to move through the graph and view values for each date segment.
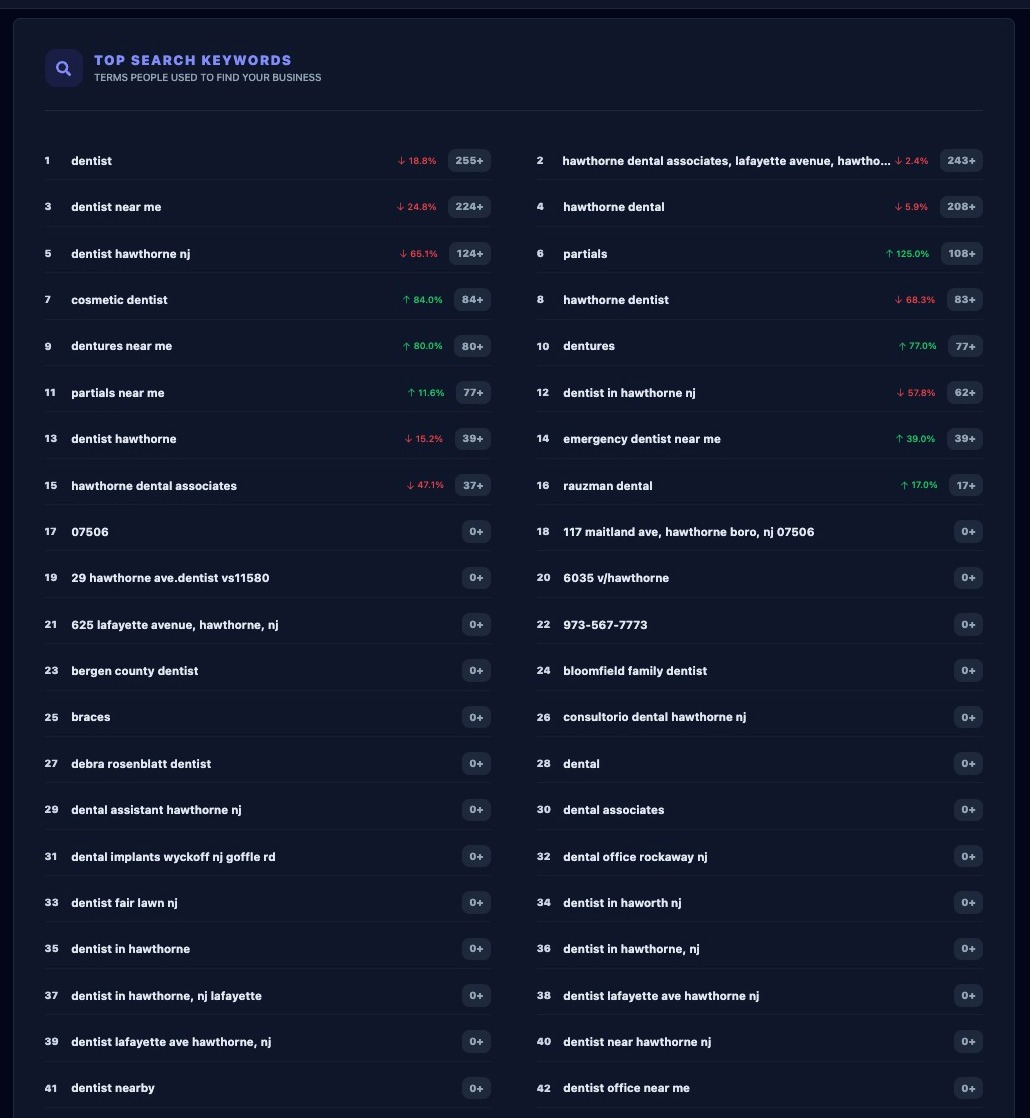
GBP Search Keywords
Below the eight metric panels are two additional metric panels. The first is the Top Search Keywords section, which displays the terms people used to find the business.
Each keyword includes the total number of times it was searched during the selected date range. It also displays the percentage change upward, shown in green, or downward, shown in red, based on the selected comparison toggle.
Performance History
The Performance History section displays trends over the selected time period.
Google Business Profile insights are typically delayed by 2–3 days. The data shown here is aggregated from the Google Business Profile Performance API.
Metric definitions include Impressions, which are the number of times the profile was shown on Google Search or Maps, and Total Actions, which are the combined count of calls, direction requests, and website clicks.
When reviewing performance trends, compare similar date ranges and allow for the normal Google Business Profile data delay. This helps avoid drawing conclusions from incomplete or recently updated data.